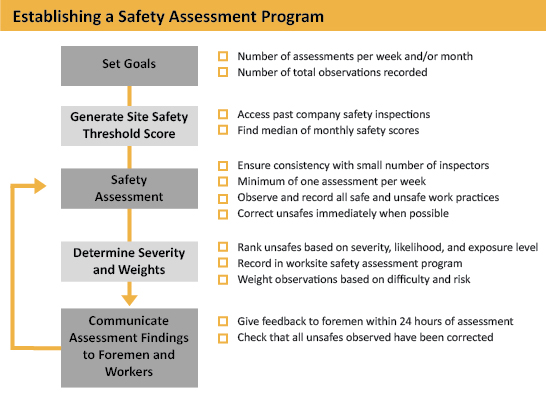
For the purposes of this program, a trained safety inspector should conduct assessments on a regular basis (a minimum of once per week) that are site-wide and comprehensive of all trades and tasks. Assessments should focus on the physical working conditions of the site (both safe and unsafe conditions) and can also include a review of pre-task plans, and worker training protocols. All unsafe working conditions observed should be discussed at the time of assessment and a plan for fixing the situation is established immediately. All observations are noted by contractor or subcontractor, not individual worker.
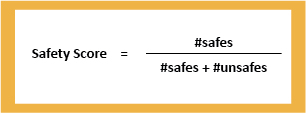
Safety performance scores for the whole site, as well as for individual subcontractors, are generated based on the number, category, and severity of safe and unsafe observations. Observations are recorded into an online database, and summary reports are distributed to site management and foremen ideally within 24 hours of an assessment to ensure timely feedback and corrective action.

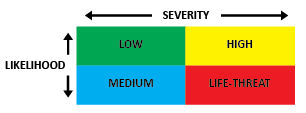
During safety assessments, safety management marks the number of safe or unsafe observations in each category. Each unsafe observation is also given a severity ranking based on the probability of occurrence and severity of the potential outcome. To ensure consistency among assessments and generated safety scores, we recommend the following logic to determine the severity of unsafe observations:
- Determining Severity
– HIGH Severity = potential injury requires hospitalization or worse
– LOW Severity = potential injury does not require hospitalization - Determining Likelihood
Use the following factors to determine the likelihood of an adverse event:
| Number of Employees Exposed |
Frequency and Duration of Exposure |
Environmental Conditions |
Stress Factors |
|---|---|---|---|
| <5, or >5 |
|
|
|
For safe observations, the weight adds points to the safety score for performing high-risk tasks safely. Weights were determined through conversations with industry experts and a review of unweighted safety inspection data. Categories with unsafe observations typically in the range of high to life- threatening severities were given a weight of 3; categories with observations typically in the medium range severity were given a weight of 2; and categories with observations typically in the low range severity were given a weight of 1. The added weights result in a safety performance score that more accurately reflect the risks and safe practices observed during a walk-through.
| Safe Category | Weight | Safe Category | Weight |
|---|---|---|---|
| Administration | 1 | ES – Ladders | 2 |
| Asbestos | 2 | ES – Powder-Actuated Tools | 2 |
| Confined Space | 3 | Excavation and Trenching | 3 |
| Control of Hazardous Energy | 2 | Fall Prevention and Protection | 3 |
| Demolition | 3 | Fire Prevention and Protection | 2 |
| Electrical Safety | 2 | Fire Prevention and Protection – Hot Work Operations | 2 |
| Environmental | 1 | Hazard Communication | 1 |
| ES – Aerial Lifts | 2 | Housekeeping | 2 |
| ES – Cranes and Hoisting Equipment | 3 | P.P.E. | 1 |
| ES – Hand and Power Tools | 2 | Public Protection | 2 |
| ES – Heavy Equipment | 2 | Scaffolding | 3 |
For unsafe observations, the weight deducts points according to severity level. The final site safety score represents the weighed number of safes out of the total number of observations.
| Unsafe Category | Weight |
|---|---|
| Low | 1 |
| Medium | 3 |
| High | 5 |
| Life Threatening | 10 |

| 1. | Find safety performance data from the past year at sites of similar size and duration from the site Owner or General Contractor (the entity running the program). |
|---|---|
| 2. | Determine monthly safety scores for individual projects. Scores should be weighted using the methods described in the previous section. |
| 3. | Rank these scores from low to high. |
| 4. | Find the median value; this is your safety threshold. |
For more information, see:
